Bacterial Genetics and Genomics book Discussion Topic: Chapter 16, question 14
Continuing on from the blog post last month, I am keeping on the topic of research that can be done at home, or at the computer, without needing to do experiments in the lab. Quite a lot of genetics and genomics research today involves the investigation of data and analysis of that data using computational approaches. This requires a lot of care, time, and attention at the computer, so there is plenty that can be done outside of the lab to advance our research.
This week, I have drawn from the Discussion Topic question at the end of Chapter 16 in Bacterial Genetics and Genomics. This chapter focuses on gene analysis techniques. This second Discussion Topic asks us to look at what we can learn about the structure of a bacterial protein from just its amino acid sequence.
As we know from the rest of the book, the amino acid sequence itself is based on the codons encoded in the DNA sequence. These form the string of amino acids that we can read on a page, but this is not how the amino acids are present in the protein. Those amino acids, joined together by peptide bonds, are folded and twisted in upon each other, to form a three-dimensional structure, maybe on its own, maybe with other copies of the same protein, or maybe with other proteins.
Using the same amino acid sequence that I used in last month’s blog, I am going to see if I can find a structure to the hypothetical protein that I investigated. Since it is hypothetical, it is highly unlikely that anyone has crystalized and experimentally determined the structure of this specific protein; it is not likely to have been previously investigated, since the function hasn’t been determined. But, there may be another protein that is similar to it for which a structure is known.
As for last month, I have the protein sequence in FastA format, which has a first like starting with “>” followed by some information about the sequence, and then the sequence data starting on the second line:
>Hypothetical protein for blog post analysis
MIKQIIEE….
One strategy is to do a BLASTP search. You may be thinking – but Dr. Snyder, you did that last month. Yes, I did, but this time, I will alter the settings somewhat.
On the BlastP screen, I have pasted my FastA format sequence into the query field. In the Choose Search Set, rather than searching the Non-redundant protein sequences (nr) as I did last month, today I am searching the Protein Data Bank proteins (pdb). This is a repository of 3D protein structures and other large biological molecules.
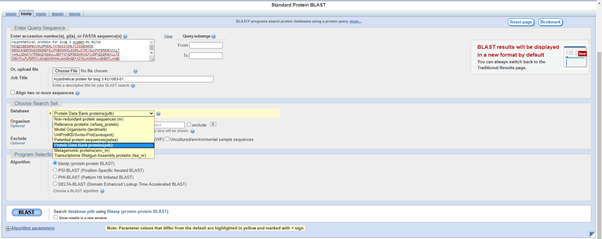
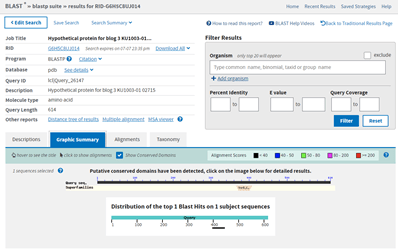
When I press BLAST, I get this result. Not great, since there is only one hit and it is to an algae Euglena gracilis.

The E value is terrible at 9.3. The query coverage is only 7%, as is graphically evident in the graphic summary tab:

The small black bar under the 400 position is the area where there is some similarity between my hypothetical protein and the E. gracilis protein hit. This is the alignment, which shows just how few amino acids align between the two proteins.
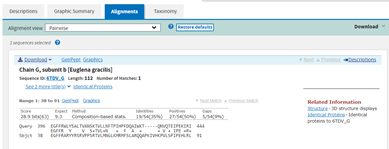
There might possibly be enough similarity in this region to suspect that the structure of this part of the protein, maybe the folds involved there, might be similar, but I’d be much happier if I had come across the structure of something with some much closer similarly.
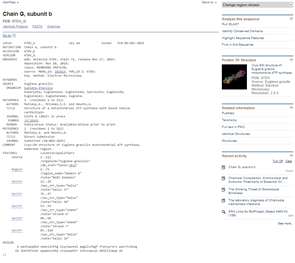
However, for the purposes of illustration in the blog, let’s have a look. Returning to the Descriptions tab, there is information about the E. gracilis hit, including the Accession number 6TDV_G.

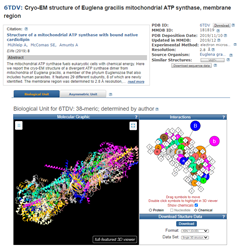
Clicking on this link takes me to the entry for this sequence and structure data.
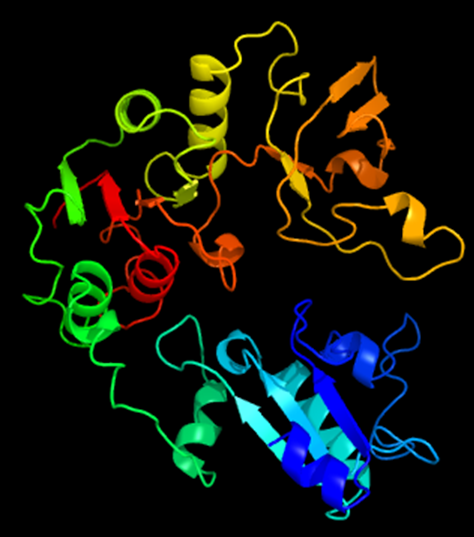
Clicking on the Protein 3D Structure picture at the right brings me to the 3D model, which is available in formats that mean I can set it to spin and show the full 3D rotation display in a full-featured 3D viewer.
Since there is so little similarity and since what little similarity there is matches a small portion of this larger structure, I am going to leave that bit of analysis and try something else. You might have noticed from the BlastP results that on the Graphic Summary tab there was some additional information. Note where it says: Putative conserved domains have been detected, click on the image below for detailed results. This is generated because when a BlastP is run, it also runs a Conserved Domain search (https://www.ncbi.nlm.nih.gov/Structure/cdd/wrpsb.cgi). This result is not always present; it only shows up when the Conserved Domain search finds a conserved domain in the query protein sequence.
Clicking on the image for the conserved domains, I can see that there is a UvrD-like helicase C-terminal domain.
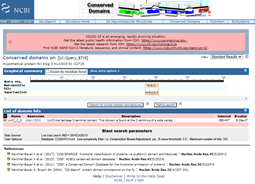
To learn more, I click on the [+] next to the name of the domain. The additional information tells me that this domain is found at the C-terminus of a wide variety of helicase enzymes and that the domain has an AAA-like structural fold. This may fit with some of the PSI-BLAST results from last month, which hit on some AAA family ATPases, and should be investigated further to find out about these types of proteins and the importance of this domain and its structure.
Out of curiosity, to see if any additional information can be yielded about the protein from other sources, I tried the PredictProtein search (open.predictprotein.org). This web-based search includes “whatever can reasonably be predicted from protein sequence with respect to the annotation of protein structure and function.” Because it does so many analyses, this took a while, but there were some results that came from it.
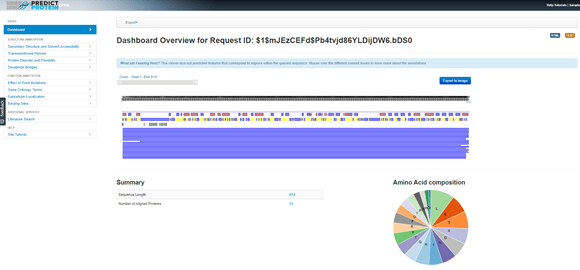
In the blue message bar at the top it says, “What am I seeing Here? This viewer lays out predicted features that correspond to regions within the queried sequence. Mouse over the different coloured boxes to learn more about the annotations.” Doing that across the boxes above the solid blue lines, where there is a row of red and blue boxes, I find that the red boxes indicate potential helices and blue boxes are potential strands. So, that gives us some structural information already, which will be based on the potential of the amino acid sequence and the properties of the side chains of those amino acids. The next line down has yellow and blue boxes. The blue boxes here are regions of the protein that are predicted to be ‘exposed’ as in they are surface exposed on the 3D protein, while the yellow boxes are those that are ‘buried’ within the protein once it is folded. It is interesting to compare the data from the first line with the second here.
There is a lot to explore here. Clicking on the link Secondary Structure and Solvent Accessibility in the menu on the left shows that information in more detail.

Clicking on Subcellular Locations from the left menu gives a prediction of where the protein might be located in the cell. I need to select the Bacteria tab here, because the default assumption is Eukarya, but the analysis has been done and the results are there waiting for me. Since the results so far suggest that this hypothetical protein might have enzymatic activity, it is not surprising that the location prediction is ‘cytoplasm’.
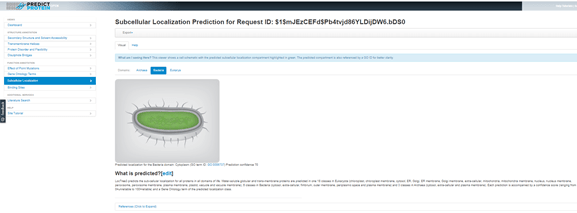
In each case where a prediction is made the evidence is presented and there are references cited at the bottom of the page for the tools used to generate the predictions, so that both the PredictProtein and original tools references can be cited in any publications that might result from research using this web resource.
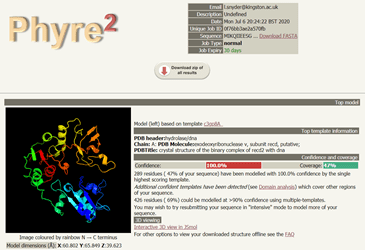
There are a variety of additional tools that can be used on protein sequences to analyse them and perhaps understand something more about the sequence. To see if perhaps I can understand any more about the possible structure of this protein, I decided to try Phyre2 (www.sbg.bio.ic.ac.uk/phyre2), Protein Homology/analogY Recognition Engine V 2.0. This uses remote homology detection methods combined with analysis of the primary amino acid sequence data to construct a 3D protein structure.

Again the results took some time to generate. Remember, these are computationally intense processes being done at PredictProtein and Phyre2, so be patient. In fact, Phyre2 gives users the option of running the modelling in Normal or Intensive Mode. I chose Normal for the sake of time, but for research, I would likely got back and do Intensive. In the end it was worth waiting for the results, because I got a lovely image of a potential protein structure to associate with my hypothetical protein of interest. It can be viewed in 3D mode as well, so I can move it around with my mouse and have a look at the structure from all angles.
More models are presented farther down the page in a table, displayed in order of decreasing confidence scores. Beside each is a graphic indicating the portion of the input protein sequence that has been represented by the model.

All of the results I have been looking at in this blog are predictions. The protein, when made in the bacterial cell, may fold very differently from these predictions and it should be remembered that biologically protein structures can and do change due to a variety of factors like temperature, substrate binding, and phosphorylation. However, prediction can be used as a guide for experiments and investigations. If, for example, I was investigating a gene containing a SNP, which changed an amino acid in the encoded protein, I might want to know where that amino acid was located in the final protein structure. Predictions like these might help identify the location of the changed amino acid. Is it embedded inside a membrane? Is it buried within the folded protein? Or is it prominently on the surface of the protein where it might be important for interacting with other proteins or within what is believed to be the active site of an enzyme where it is involved in the binding of substrate?
I hope that this blog and the one before has been useful in demonstrating some of the tools available for doing research outside of the lab. This theme will continue next month when I tackle the last discussion topic of Chapter 16 and investigate restriction enzyme digest sites.